Welcome to the fourth entry in my series where I document my journey of cataloguing my enamel pin collection. If you missed the previous posts, you can catch up here. Previously, I introduced a simple app that segments each pin, assigning unique identifiers and names. Although I shared some future enhancements at the end of my last post, it dawned on me that I had slightly deviated from my main objective: effectively showcase my collection.
In this update, I’ll take you through the process of integrating all previous developments into a single interactive webpage. This page highlights each pin, with detailed information accessible via mouse hover, all crafted using HTML, JavaScript, and jQuery.
As always, let me show you what the end product looks like:
[Video of the app running]
And the live web page of my pin collection showcase v2 here.
Improving the quality of the cutout
Before getting into the front-end development, I wanted to try a couple of things to improve the quality of the cutout.
If you remember, from a previous post, the output of the Segment Anything Model is a set of masks covering where the segmented object is, however, for my use case the edges of the masks always ended up being a bit jagged, too pointy and complex, so I created the following function in an attempt to simplify the edges of the mask:
def refine_mask(image, mask):
    polygons = [Polygon(poly) for poly in sv.mask_to_polygons(mask)]
    single_polygon = unary_union(polygons)

    if single_polygon.geom_type == "Polygon":
        selected_polygon = single_polygon

    elif single_polygon.geom_type == "MultiPolygon":
        selected_polygon = max(single_polygon.geoms, key=lambda x: x.area)

    else:
        raise ValueError(f"Unexpected geometry type: {single_polygon.geom_type}")

    simplified_polygon = simplify(selected_polygon, 1.0)

    selected_polygon = simplified_polygon.buffer(10, join_style=1).buffer(-10.0, join_style=1)
    polygon = []
    for x, y in zip(selected_polygon.exterior.xy[0], selected_polygon.exterior.xy[1]):
        polygon.append(x)
        polygon.append(y)

    new_mask = sv.polygon_to_mask(
        np.array(selected_polygon.exterior.coords, dtype=np.int32),
        (image.shape[1], image.shape[0]),
    )

    return new_mask, polygon
A brief description of the function behaviour is:
Parameters
- image: This is the original image associated with the mask. It is used to determine the dimensions for the new mask.
- mask: This is a binary mask produced by SAM where the areas of interest are marked.
Function Body
Convert Mask to Polygons
polygons = [Polygon(poly) for poly in sv.mask_to_polygons(mask)]Converts the mask into a list of shapely’s Polygon objects. It is achieved by detecting contours or similar features in the mask using the supervision library’s mask_to_polygons.
Merge Polygons
single_polygon = unary_union(polygons)Combines these polygons into a single polygon using shapely.ops.unary_union, which efficiently merges overlapping or adjacent polygons.
Select Largest Polygon (if necessary)
if single_polygon.geom_type == "Polygon":
    selected_polygon = single_polygon
elif single_polygon.geom_type == "MultiPolygon":
    selected_polygon = max(single_polygon.geoms, key=lambda x: x.area)
else:
    raise ValueError(f"Unexpected geometry type: {single_polygon.geom_type}")
Checks the geometry type of the resultant polygon. If it’s a MultiPolygon (which in my case happens quite often), it selects the polygon with the largest area, assuming that that largest area is one that contains the pin.
Simplify Polygon
simplified_polygon = simplify(selected_polygon, 1.0)Simplifies the polygon’s shape to reduce the number of vertices, making the shape easier to handle and process, the simplify function comes from the shapely module.
Buffering
selected_polygon = simplified_polygon.buffer(10, join_style=1).buffer(-10.0, join_style=1)Applies a buffer of 10 units outward and then -10 units inward to smooth and regularise the edges, potentially cleaning up the polygon’s boundary.
Extract Coordinates
polygon = []
for x, y in zip(selected_polygon.exterior.xy[0], selected.polygons.exterior.xy[1]):
    polygon.append(x)
    polygon.append(y)
Extracts the x and y coordinates from the exterior of the selected polygon and stores them in a list where the coordinates are laid like this: [x1, y1, x2, y2, ..., xn, yn], which is useful when showing the polygon in the front end as image maps.
Convert Polygon to Mask
new_mask = sv.polygon_to_mask(
    np.array(selected_polygon.exterior.coords, dtype=np.int32),
    (image.shape[1], image.shape[0]),
)
Finally, converts the simplified polygon back into a mask format with the original image’s dimensions.
Returns
- new_mask: The refined mask derived from the largest or simplified polygon.
- polygon: The coordinates of the simplified polygon.
Some results

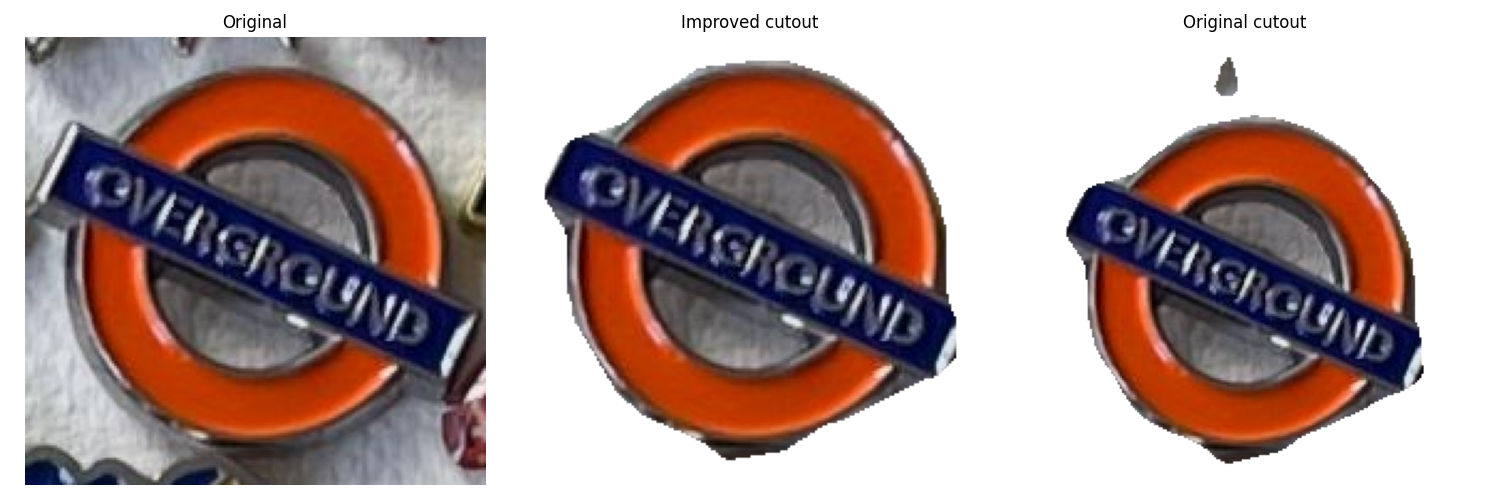
In this image, it is possible to see how in the original cutout there was an extra bit of image that does not belong to the pin badge, with the refining function we got rid of it.

The refining function not only helps in removing the unwanted bits of the image but also helps in removing empty spaces that should not be there.

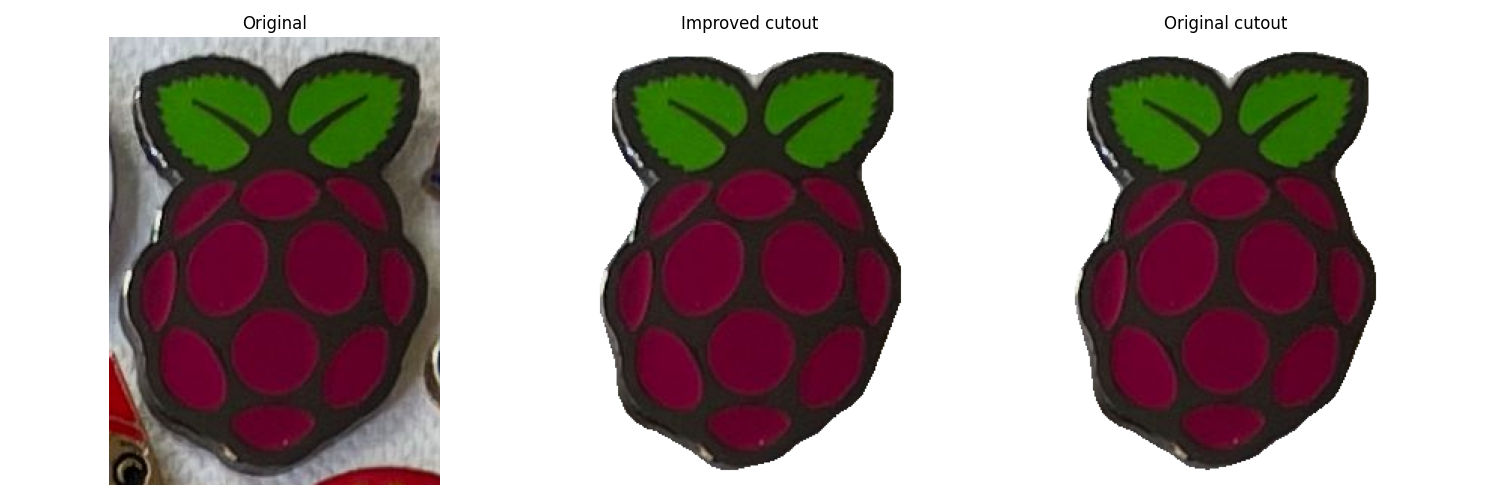
However, the benefits of the refining function is not always visible, as shown above.
Front-end
Now, on to the front-end, where most of the time was invested.
A new view endpoint
I added a new endpoint to my FastAPI app, this endpoint serves the existing masks rendered into an HTML that will show the original image along with an HTML map element:
@app.get("/view/")
def get_view(request: Request):
    existing_cutouts = load_selected_cutouts()

    return templates.TemplateResponse(
        "view.html.jinja",
        {
            "request": request,
            "imageWidth": og_image.width,
            "imageHeight": og_image.height,
            "existing_cutouts": existing_cutouts,
            "image": turns_image_to_base64(og_image),
        },
    )
The view.html.jinja template:
The template is quite simple since most of the interactivity and functionality is in the JavaScript code that I will explain later:
<!DOCTYPE html>
<html lang="en">
<head>
<!-- Code omitted for brevity -->
</head>
<body>

  <img src="{{image}}" alt="Enamel Pins Collection" id="canvasMapContainer" usemap="#pinmap">

  <map name="pinmap" id="pinmap">
      {%- for cutout in existing_cutouts %}
      <area shape="poly" coords="{{cutout.polygon | join(',')}}"
        data-name="{{cutout.name}}"
        {%- if cutout.description %}
        data-description="{{cutout.description}}"
        {%- endif %}
        alt="{{cutout.name}}" data-key="{{cutout.uuid}}" href="#">
      {%- endfor %}
  </map>

  <!-- Modal -->
  <dialog id="modal">
    <article>
      <header>
          <h3 id="infoPinNameModal"></h3>
      </header>
      <p id="infoPinDescriptionModal"></p>
    </article>
  </dialog>

  <!-- Tooltip -->
  <div id="tooltip" style="display: none;">
    <article>
      <header><h3 id="infoPinNameTooltip"></h3></header>
      <p id="infoPinDescriptionTooltip" style="display: none;"></p>
    </article>
  </div>

	<script>
	/* Functionality described below */
	</script>
</body>
</html>
There are five key pieces to this app:
- The
imgtag withcanvasMapContaineras id. This image will show the image containing all the pins. This image is the same I have been working with across these series of posts. The tag hassrc="{{image}}"where the image is provided via the server as a base46 image. Another thing to note about this image tag is that it has the propertyusemapset to"#pinmap", this lets the browser know that there is an image map attached to this image. - The
maptag contains areas that correspond to different parts of the enamel pin canvas, notice how the map’snameproperty matches the value set asusemapin the image above. These values are set dynamically at render time, the loop{%- for cutout in existing_cutouts %}allows us to create anareaelement with information such as polygon coordinates, name and descriptions for each of the pins. - A
dialogtag withmodalas id. This element is used to display more detailed information about a selected pin. This element is hidden by default and only shown whenever a user clicks on a pin. - A
divthat works as a floating tooltip that displays basic information about the pin over which the user is hovering the cursor. Just like the modal dialog above, this tooltip is hidden initially and shown on certain interactions defined in the script below. - The fifth element is a
scriptthat orchestrates the whole functionality of the app, it requires more than a simple paragraph to explain its functionality, continue reading to learn more about it.
The app’s logic
Dependencies
- jQuery: A fast, small, and feature-rich JavaScript library, some people may think it is quite outdated, however, it simplifies things like HTML document traversal and manipulation, event handling, and even animation.
- ImageMapster: A jQuery plugin that provides interactive image maps functionality. It allows images to be used with areas that can be manipulated and interacted with in various ways.
Functionality
Everything happens after the document has been loaded, inside a $(document).ready(function() { }); definition.
Modal and Tooltip Interaction:
The script initialises variables for modal and tooltip elements, as well as several configuration variables for classes and animation timing.
  const $modal = $("#modal");
  const isOpenClass = "modal-is-open";
  const openingClass = "modal-is-opening";
  const closingClass = "modal-is-closing";
  const scrollbarWidthCssVar = "--pico-scrollbar-width";
  const animationDuration = 400; // ms
  const padding = 10;

  const $tooltip = $("#tooltip");
  const $infoPinNameTooltip = $("#infoPinNameTooltip");
  const $infoPinNameModal = $("#infoPinNameModal");
  const $canvasMapContainer = $("#canvasMapContainer");
  let visibleModal = null;
It defines functions to toggle, open, and close the modal. The modal can be opened or closed either by clicking on an area of the image map or using the Escape key.
  // Toggle modal
  const toggleModal = () => {
      if (!$modal.length) return;
      $modal[0].open ? closeModal() : openModal();
  };

  // Open modal
  const openModal = () => {
      $("html").addClass(isOpenClass).addClass(openingClass);
      setTimeout(() => {
          visibleModal = $modal;
          $("html").removeClass(openingClass);
      }, animationDuration);
      $modal[0].showModal();
  };

  // Close modal
  const closeModal = () => {
      visibleModal = null;
      $("html").addClass(closingClass);
      setTimeout(() => {
          $("html").removeClass(closingClass).removeClass(isOpenClass);
          $("html").css(scrollbarWidthCssVar, '');
          $modal[0].close();
      }, animationDuration);
  };

  // Close with a click outside
  $(document).on("click", (event) => {
      if (visibleModal === null) return;
      const isClickInside = $(visibleModal).find("article").has(event.target).length > 0;
      if (!isClickInside) closeModal();
  });

  // Close with Esc key
  $(document).on("keydown", (event) => {
      if (event.key === "Escape" && visibleModal) {
          closeModal();
      }
  });
Interactive Image Map Setup
The image map is initialized with the ImageMapster plugin, which is configured to not allow selection (highlighting) of map areas but to react to mouse events – this plugin’s documentation is top-notch.
$canvasMapContainer.mapster({
    enableAutoResizeSupport: true,
    autoResize: true,
    isSelectable: false,
    stroke: false,
    strokeColor: '00FF00',
    strokeWidth: 5,
    mapKey: 'data-key',
    fillOpacity: 0.0,
// ....
On clicking an image map area, the script fetches the area’s data attributes (like name), updates the modal’s content, and toggles the modal’s visibility.
    onClick: function (data) {
        $infoPinNameModal.text(data.e.target.dataset.name);
        toggleModal();
    }
On mouseover, the tooltip’s content is updated based on the hovered area’s data attributes, and its position is dynamically calculated to appear near the cursor but adjusted to avoid overflowing the viewport.
    onMouseout: function() {
        $tooltip.hide();
    },
    onMouseover: function(data) {
	    // ... see below for the dynamic positioning
Dynamic Positioning:
The tooltip’s position is calculated based on the coordinates of the hovered area. The script ensures that the tooltip does not overflow the window edges by adjusting its position relative to the image map area’s boundaries.
Position calculations take into account the current scroll position and the tooltip’s dimensions to ensure it is always visible.
      const coords = $(this).attr('coords').split(',').map(coord => parseInt(coord, 10));
      const xCoords = coords.filter((_, i) => i % 2 === 0);
      const yCoords = coords.filter((_, i) => i % 2 === 1);
      const x1 = Math.min(...xCoords);
      const y1 = Math.min(...yCoords);
      const x2 = Math.max(...xCoords);
      const y2 = Math.max(...yCoords);
      const centerX = (x1 + x2) / 2;

      $infoPinNameTooltip.text(data.e.target.dataset.name);

      const infoWidth = $tooltip.width();
      const infoHeight = $tooltip.height();

      let positionX = "centre";
      if (x1 - infoWidth - padding < 0) {
          positionX = "left";
      } else if (x2 + infoWidth + padding > $canvasMapContainer.width()) {
          positionX = "right";
      }

      let positionY = "top";
      if (y1 - infoHeight - padding < $(window).scrollTop()) {
          positionY = "bottom";
      }

      const positionXmap = {
          "left": x2 + padding,
          "centre": centerX - infoWidth / 2,
          "right": x1 - infoWidth - padding
      };

      const positionYmap = {
          "top": y1 - padding - infoHeight,
          "bottom": y2 + padding
      };

      $tooltip.css({
          top: positionYmap[positionY],
          left: positionXmap[positionX],
      }).show();
In a real-world production app, this script probably should exist in its own file, however, as this is just a toy project, it is currently inlined along with the HTML code.
Conclusion
This project has been an enriching learning experience, and although the results haven’t fully met my expectations yet, I believe it’s time for a pause. Juggling multiple interests and responsibilities, including learning, writing, and teaching, demands that I prioritise my commitments.
In the meantime, I will keep a list of the ideas that come to my mind to improve the results of the processes I have been describing here, and, if you have ideas on how I could improve this project or want to share your experiences with similar projects, please leave a comment below or reach out to me on Twitter.
If you are looking for all the code I have written so far, everything is on GitHub, feel free to use it for your own projects!